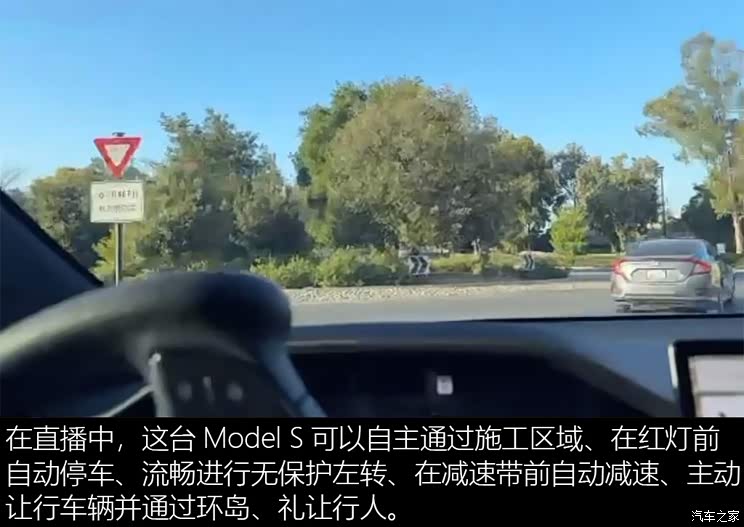
[Interpretation of car home’s New Technology] On August 26th, US time, Tesla CEO elon musk personally experienced the latest driver assistance system software equipped with FSD V12, during which the video was broadcast live for about 45 minutes. According to reports, the FSD V12 software will adopt an end-to-end neural network algorithm, no longer relying on map data. With the destination coordinates, the vehicle will automatically navigate and drive past. The new version of the software is also expected to be installed on the newly released new model (|), which is very worth looking forward to. Let’s take a look at Tesla FSD V12 software and see why it is so amazing!
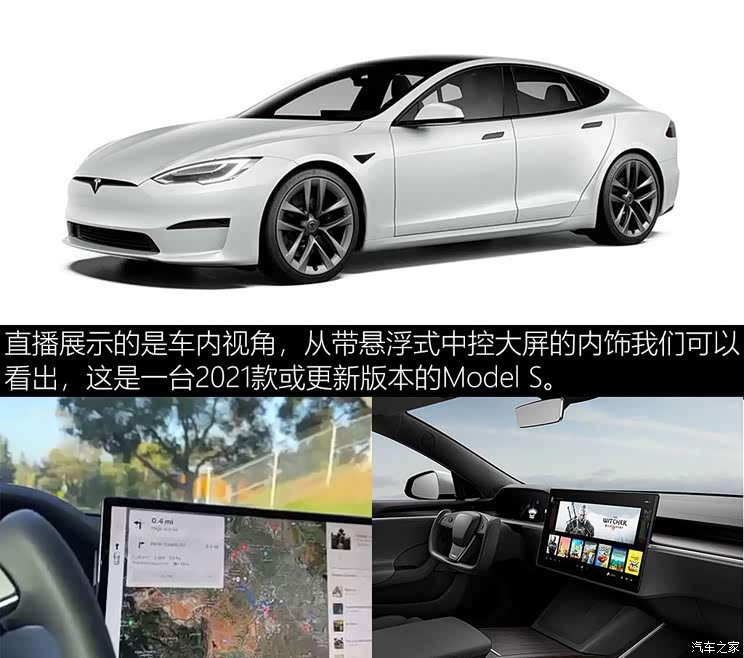
● Model S with FSD V12 software installed.
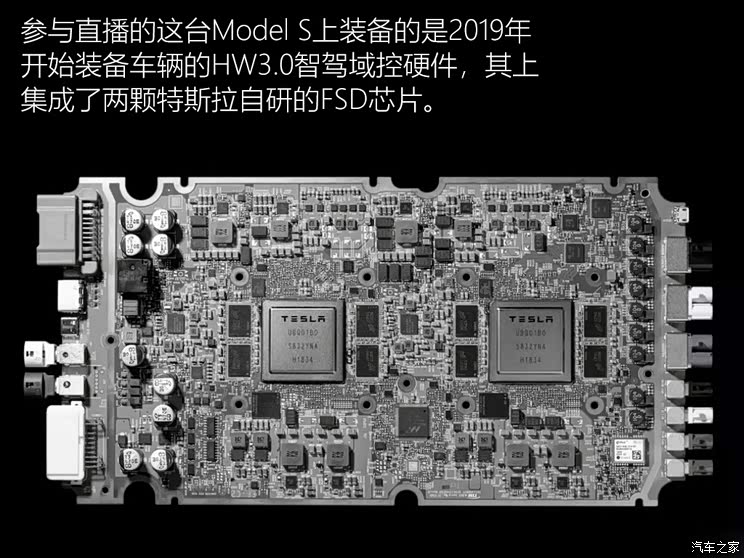
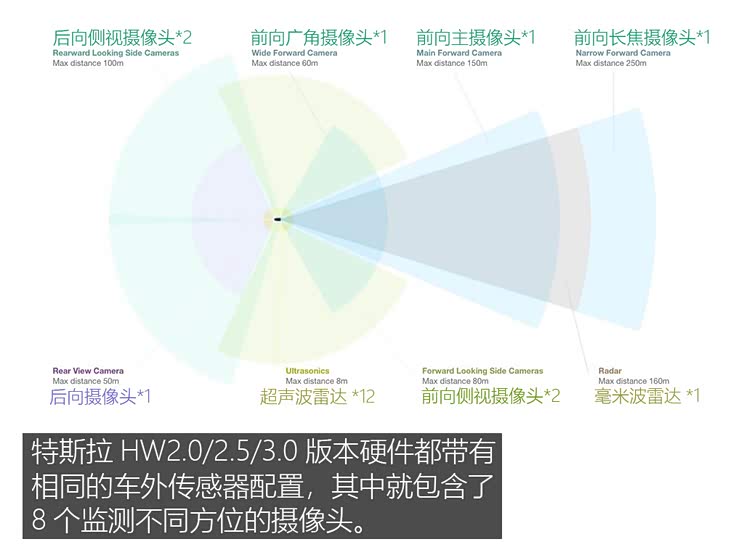
The vehicle in the live broadcast is a Model S equipped with HW3(Hardware 3.0) driver assistance hardware system, on which the latest version of FSD V12 software is installed. This HW3 hardware is made of FSD chip independently developed by Tesla, manufactured by 14 nm process, with a single chip computing power of 72TOPS. Each HW3.0 hardware is equipped with two FSD chips, with a total power of 144TOPS and a total power consumption of 200W W.
The latest version of FSD V12 software does not use the newly released HW4.0 hardware with further improved performance. This aspect reflects that the FSD V12 software is now developed based on HW3.0 hardware, and the computing power of HW3.0 hardware can fully meet the requirements of FSD V12. In the future, it is only a matter of time before this software algorithm is transplanted to HW4.0 with stronger computing power.
● What is the biggest upgrade of FSD V12 software?
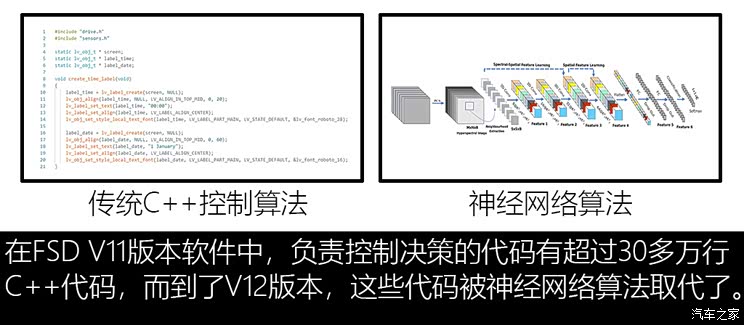
The biggest upgrade of FSD V12 software is to adopt a set of end-to-end algorithm scheme. Speaking human words is,The driver assistance system inputs the image data obtained by the camera into the neural network, and the network can directly output vehicle control instructions (such as steering, acceleration, braking, etc.)..
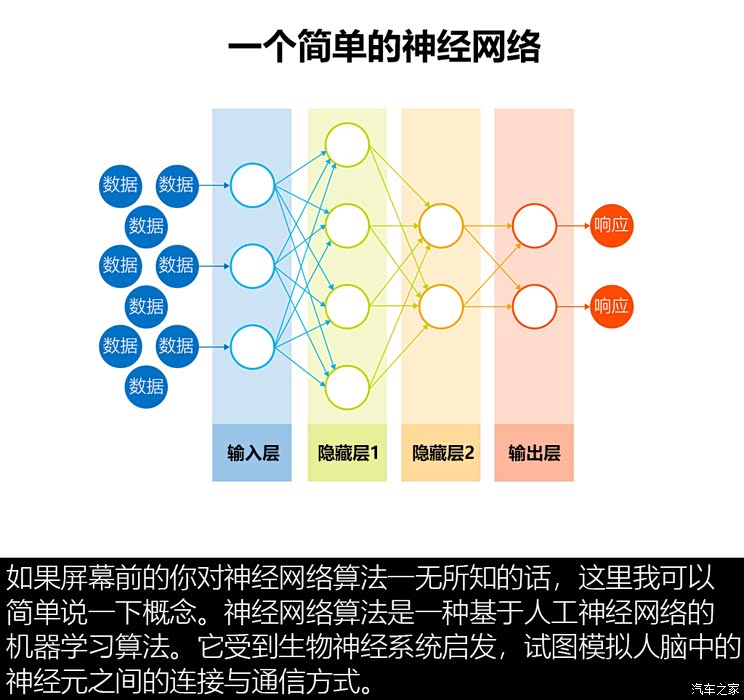
Neural network algorithm is composed of several interconnected artificial neurons, which are arranged in a hierarchical structure. Through repeated iterative training, the neural network can automatically learn the features and patterns of input data, and make accurate prediction or classification on unknown data. This makes the neural network algorithm widely used in image recognition, speech recognition, natural language processing, recommendation system and other machine learning tasks.
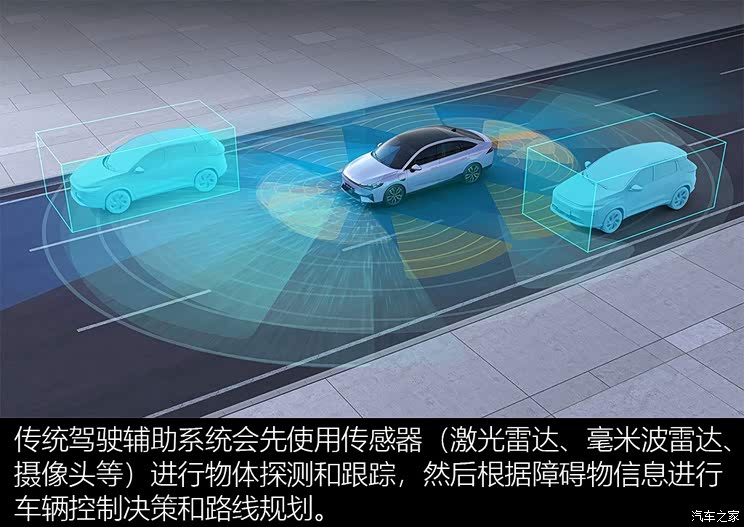
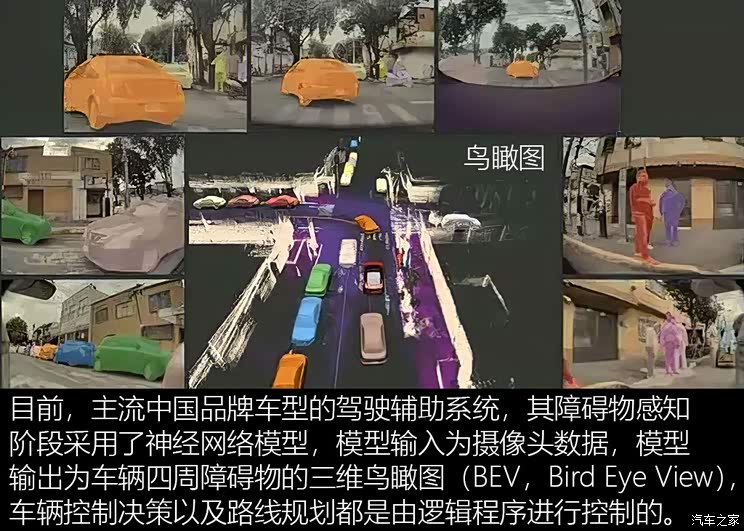
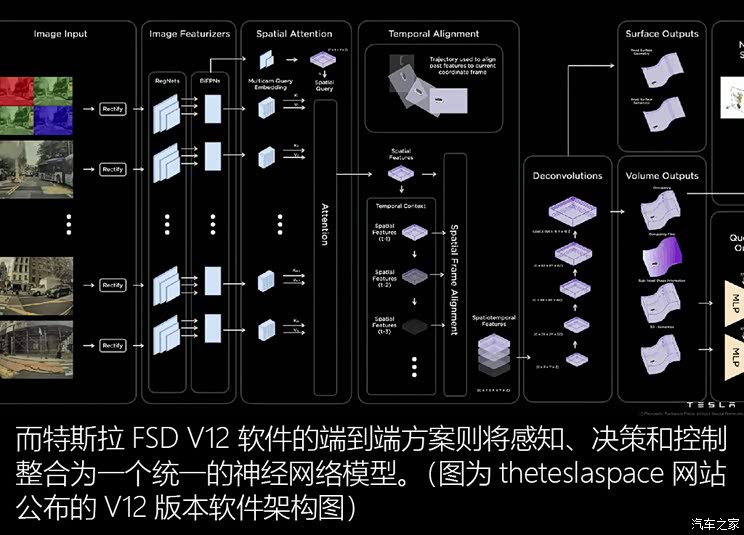
In contrast, the traditional vehicle control decision-making and route planning algorithms are realized by logical control programs, that is, codes written by programmers. Tesla’s latest end-to-end scheme also gives the function of this part of logic control code to the neural network model, which is also the most innovative place of FSD V12 software.
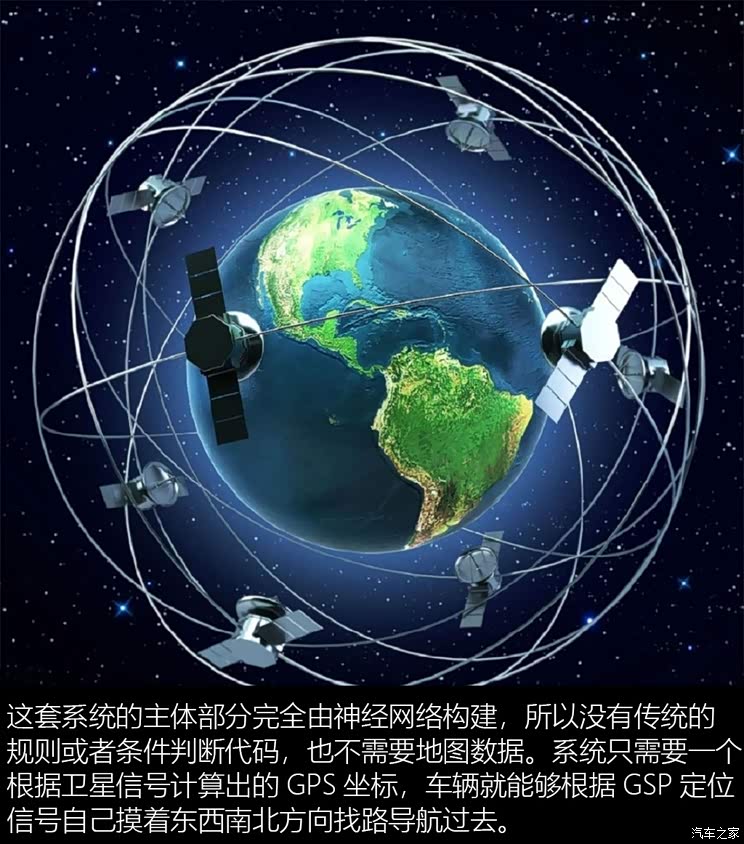
Compared with human flesh navigation, the high-precision GPS, compass, wheel speed sensor and other equipment in the car can help this driving assistance system with end-to-end scheme to achieve more accurate route planning, greatly reducing the occurrence of "passing" and "turning wrong".
Musk said that HW3.0 hardware equipped with FSD V12 software can process the data of eight cameras at 36FPS at present (HW3.0 hardware performance can support 50FPS, but camera specifications limit the improvement of frame rate), and the system power consumption is only 100 W (rated power of HW3.0 is 200W), which reflects the high efficiency of HW 3.0 and the fact that FSD V12 software does not require very much computing power.
All these vehicle control decisions are not obtained by traditional logic algorithm, but by neural network reasoning. Does it sound like a human being? When driving, human beings are often based on intuition, and intuition is produced by the neural circuits of the brain.
● How did the neural network of FSD V12 software come from?
At present, most neural network algorithms are composed of learning and reasoning. The driver assistance system obtains a neural network with optimized parameters by learning videos of various road conditions. The optimized neural network is deployed on HW3.0 hardware, and the vehicle control decision is obtained by reasoning according to the image obtained by the vehicle camera.
It is said that the decision-making of Tesla’s intelligent driving system has changed from programming logic to neural network algorithm since 2020. In fact, technological changes have already begun, but most ordinary consumers are only aware of it.
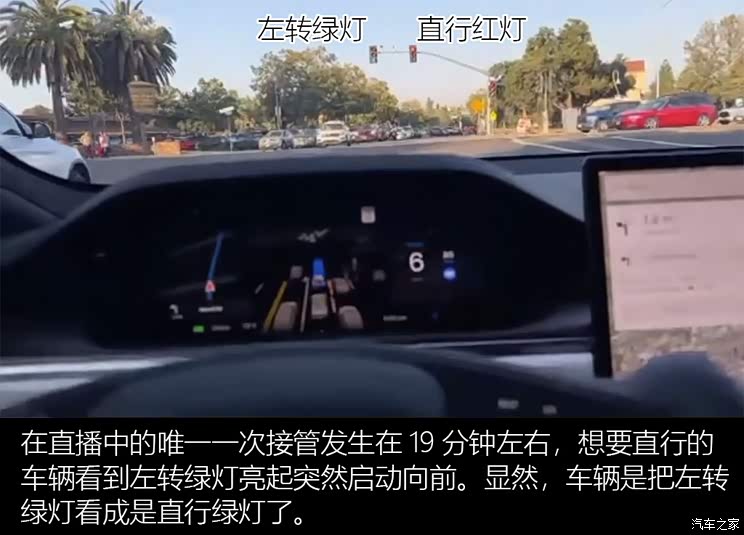
Musk also bluntly said: "This is also the reason why the V12 version of the software has not really been released publicly." At present, the V12 software also needs to optimize various Conner Case. Simply put, let the system watch more videos, conduct reinforcement learning, and further optimize the neural network architecture and network parameters.
● The popularity of end-to-end algorithms has strengthened the right to speak in computing power.
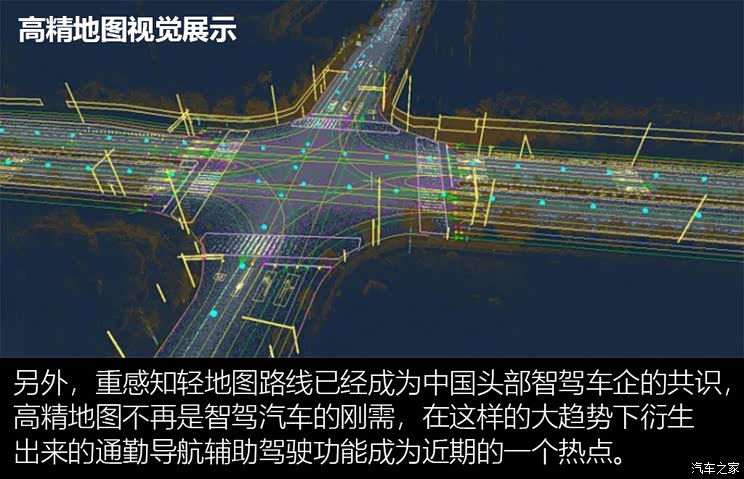
If the end-to-end algorithm is to be useful, it is necessary to constantly "feed" videos to the neural network, so that it can continuously learn and optimize its parameters. And the whole learning process is greatly dependent on the computing power of the training server. With the popularity of end-to-end algorithms, whoever has a powerful training server will have an absolute say in the field of autonomous driving.
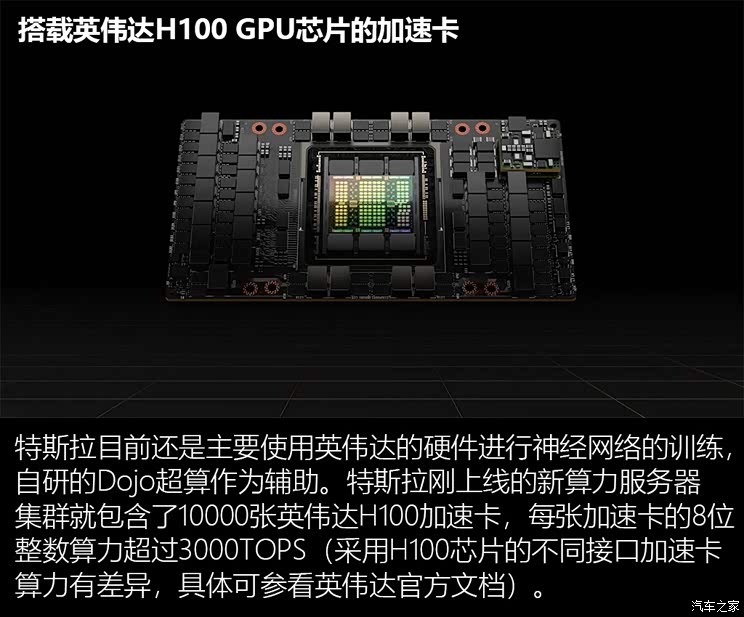
Affected by the U.S. export ban on China, it seems more difficult for China enterprises to buy the latest high-end accelerator cards in NVIDIA in large quantities. At present, although China enterprises can also produce AI acceleration chips, compared with NVIDIA, which has been deeply involved in the AI market for many years, there is a big gap in application ecological construction and chip performance, and there is still a long way to go.
With the rise of AI technology, the computing power it relies on has become an important target for technology companies to invest. Funds have been invested in the construction of intelligent computing centers, making the AI industry gradually become a heavy asset industry. To put it bluntly, whoever spends money on computing power will have good model performance, and the products will be able to launch and occupy the market faster.
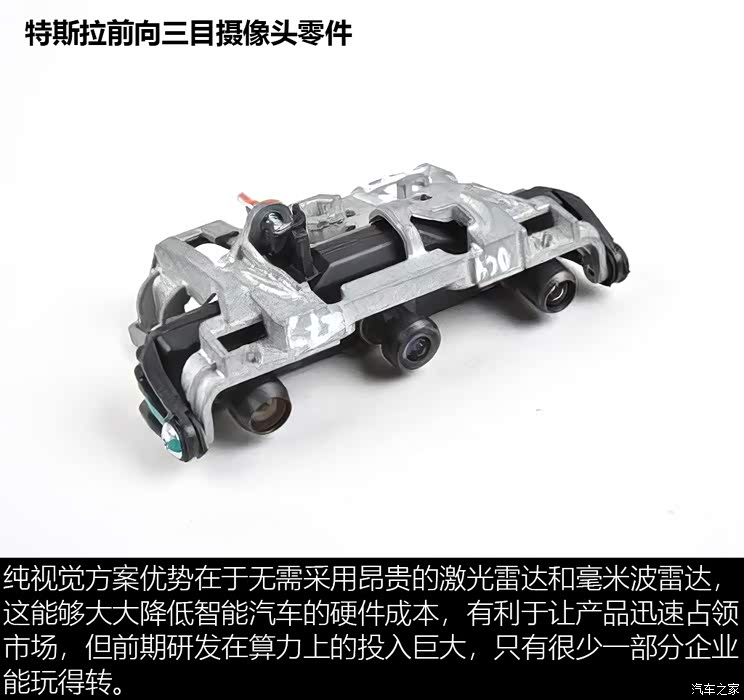
If China autonomous driving companies want to be hard with Tesla on the pure vision+end-to-end algorithm track, the chances of winning are not high; It is better to further develop the technology route of sensor fusion +V2X vehicle-road coordination, and perhaps find an automatic driving road suitable for China.
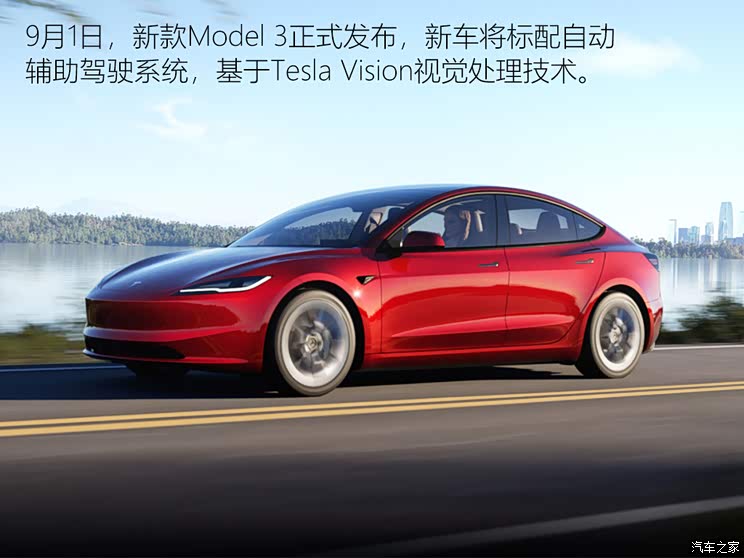
In terms of hardware, according to the information circulating on the Internet, the new Model 3 will adopt the HW3.5 version of hardware configuration, which can meet the FSD V12 version of software in terms of computing power. In other words, in the future, the new Model 3 may be expected to obtain all the functions of the FSD V12 version software through OTA upgrade, so that the vehicle intelligent driving system will enter the era of pure vision and end-to-end algorithm.
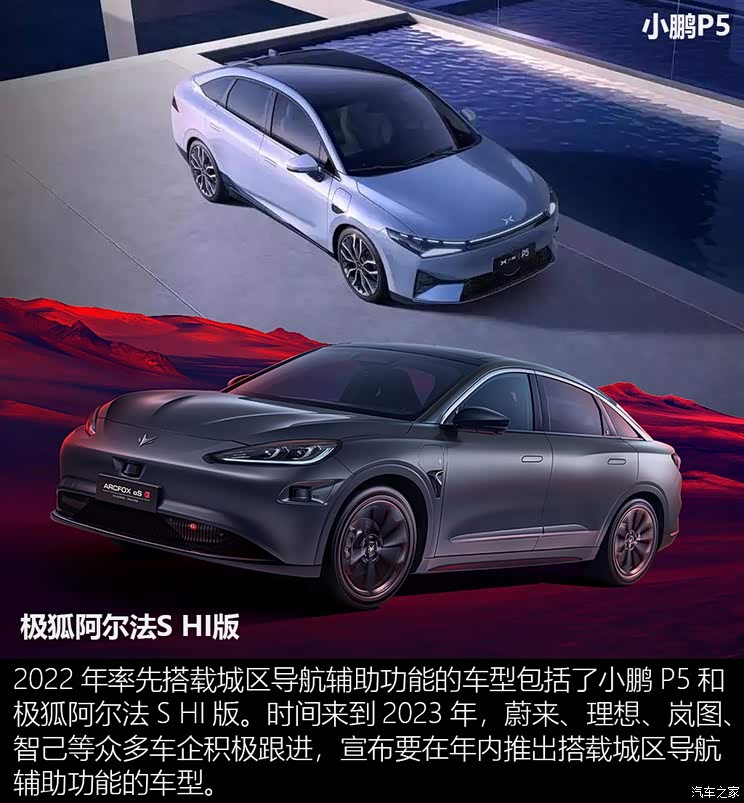
● China is entering the era of urban navigation-assisted driving.
Since the second half of last year, urban navigation assisted driving functions, represented by Tucki NGP and Huawei NCA, have gradually landed, and gradually unlocked the right to use more and more cities.
Supply chain enterprises are also gearing up, and companies such as Xiaoma Zhixing, Haomo Zhixing and Wen Yuan Zhixing are also actively providing the latest intelligent driving solutions for the main engine factory. It is foreseeable that the number of vehicles equipped with urban driving assistance functions will usher in a wave of outbreaks in 2023.
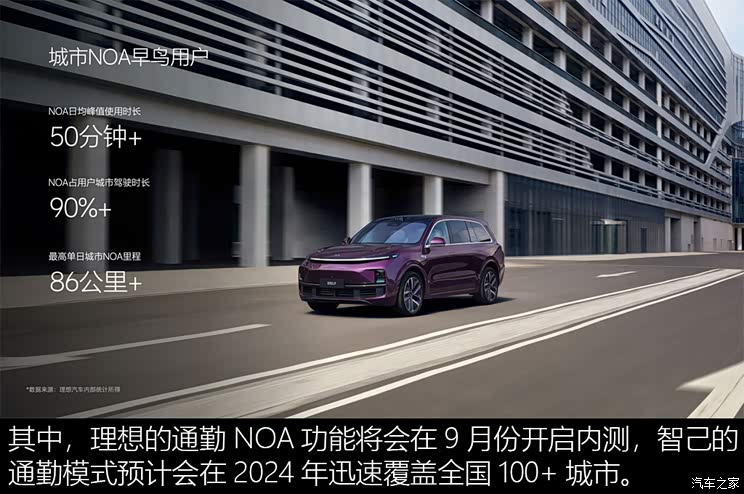
Users only need to train the vehicle on a fixed route for 1-3 weeks, and they can realize autonomous driving of the vehicle on the daily commuting route with little manual intervention.
I believe that in the future, more car companies and technology companies will "roll" the commuter navigation assistance function, further intensifying the survival of the fittest in the industry and promoting the progress of automobile intelligent driving technology.
● Full text summary:
Judging from the live video, the FSD V12 version of the software using the end-to-end neural network algorithm does have a relatively good urban navigation-assisted driving ability, but this is based on the measured performance of American roads. Compared with the road conditions in China, the road conditions in the United States are obviously simpler. Whether the FSD V12 version can withstand the hellish challenge of the road conditions in China has yet to be verified.
2023 is considered to be the first year of urban navigation-assisted driving in China, and also the beginning of the second half of driving assistance system competition. Whether it’s a mule or a horse, we have to pull it out to see. We expect Tesla’s urban NOA to land in China as soon as possible, so that we can have a chance to see how high the real strength of pure vision+end-to-end algorithm is! (Photo/Text/car home Chang Qinglin)